
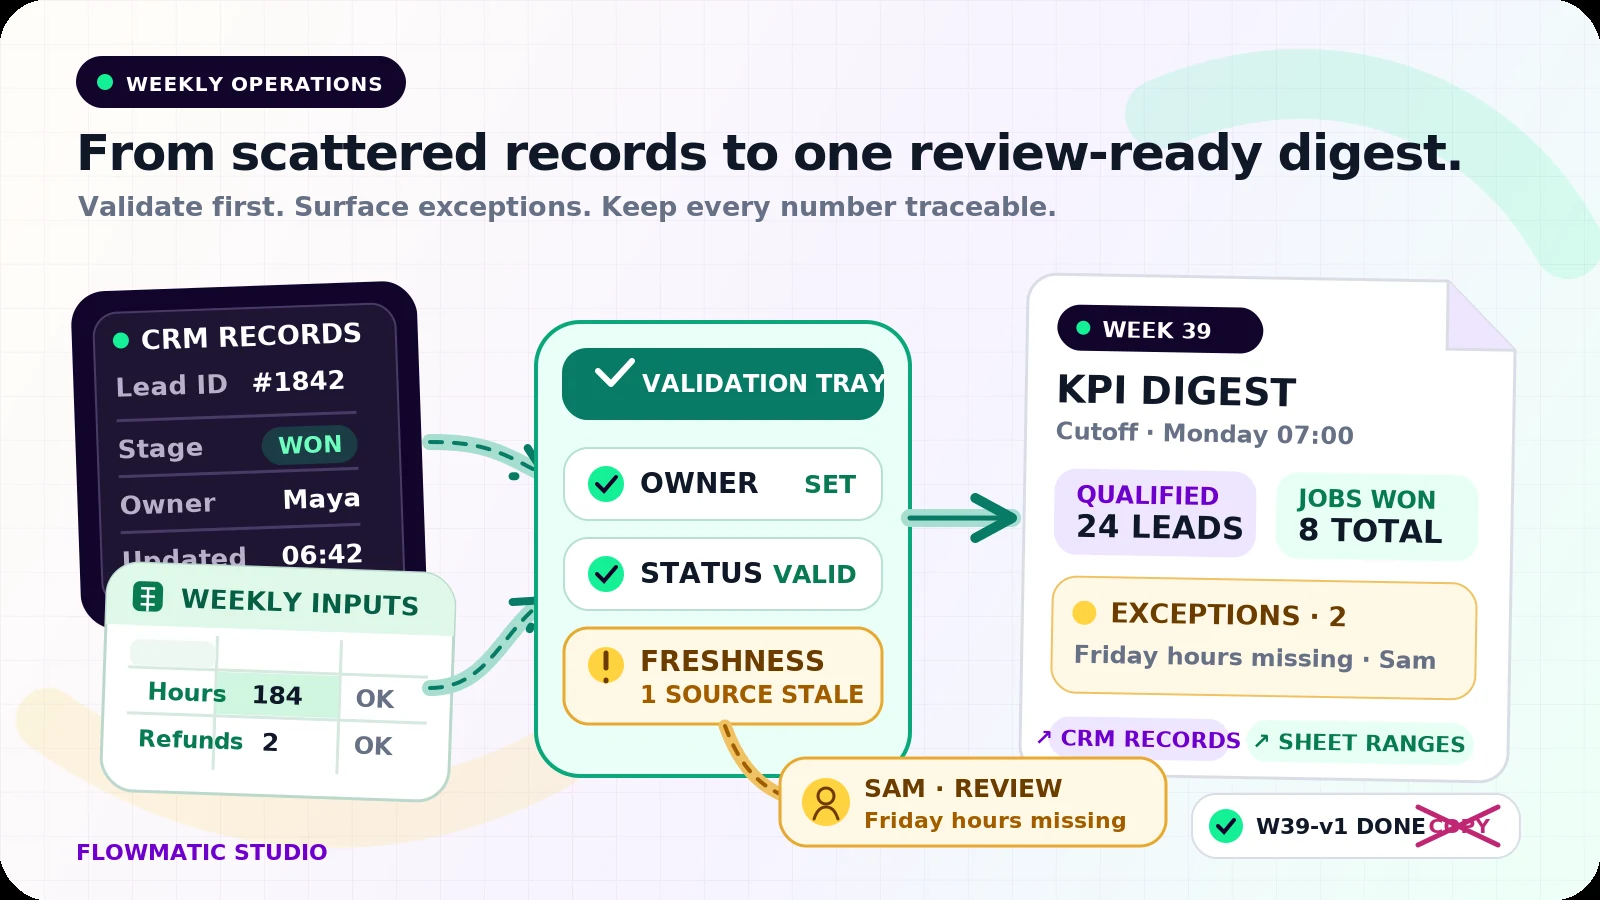
A weekly report should tell the owner what changed, what looks wrong, and who needs to act. Too often, the process starts with someone opening a CRM, copying numbers into Google Sheets, fixing labels, and sending a screenshot that nobody can trace back to the underlying records.
Weekly KPI reporting automation can remove that assembly work without creating another dashboard to maintain. The useful version is a dated digest built from agreed sources, checked for bad data, and linked back to the records behind each number.
This workflow begins after the operating processes already create structured records. If lead capture and ownership are still inconsistent, start with the small business workflow automation guide.
Decide what each system owns
Do not let the CRM and spreadsheet compete as two versions of the truth. Give every metric a named source.
The CRM might own lead ID, created date, stage, source, assigned owner, estimated value, won or lost date, and close reason. Google Sheets might own manually entered figures such as weekly labour hours, delivery totals, refunds, or a target agreed during the management meeting.
Create a small metric dictionary with:
- Metric name and plain-English definition
- Source system and exact field
- Calculation rule and reporting timezone
- Record owner and review owner
- Refresh deadline
- Drill-down destination
For example, "new qualified leads" might mean unique CRM records created during the reporting week whose qualification status equals Qualified. That definition is much safer than "count the green rows."
Validate entries before extraction
Free-text statuses create quiet reporting errors. Won, won, and Closed won may describe the same outcome but produce three groups.
Use controlled fields in the CRM. In Google Sheets, use dropdowns or validation rules for statuses, owners, and categories instead of asking people to type them repeatedly. Google Sheets supports in-cell dropdown lists, including lists populated from a range.[3]
Validation should also reject or flag impossible values: missing IDs, dates outside the reporting period, negative counts where they make no sense, duplicate record IDs, blank owners, and currencies mixed without a conversion rule.
Keep the raw source value. If the reporting workflow changes closed-won to Won for display, store that as a reporting value rather than overwriting the original.
Extract a fixed weekly snapshot
Choose a cutoff, such as Monday at 7:00 a.m. in the business timezone, and read only the fields needed for the report. A CRM export, API connection, or approved connector can supply the CRM records. The Sheets API can retrieve one or more specified ranges in a single request, which is useful when the weekly inputs live in separate tabs.[1]
Save the extraction time and the source update time with the run. A record updated after the cutoff belongs either in the next report or in a clearly marked correction. Without a cutoff, the numbers can change while the report is being reviewed.
If Google Apps Script runs the schedule, note that its time-driven triggers can execute on recurring intervals, but a chosen hour may be slightly randomized within that hour.[2] If an exact delivery time matters, schedule the extraction early enough to leave a review window.
Normalize before calculating
The reporting step should turn different source formats into one consistent table. Standardize dates to one timezone, map status variants to approved labels, trim whitespace, convert numeric text to numbers, and join records using stable IDs rather than customer names.
Do not treat normalization as permission to guess. An unknown stage should become an exception, not the nearest familiar stage. A missing owner should stay missing and appear in the digest.
Calculate the small set of KPIs after normalization. For a service business, that could include qualified leads, quotes sent, jobs won, conversion rate, overdue follow-ups, invoice value issued, and overdue balance. Each headline number should link to a filtered CRM view or Sheet range showing the records included in it.
Make stale and missing data visible
A polished total can hide an incomplete week. Add a freshness check for every source before producing the digest.
Flag the report when a source did not refresh by its deadline, when expected rows are missing, or when the latest source timestamp is older than the reporting cutoff. Show the effect plainly: "Labour hours missing for Friday" is more useful than a small warning icon.
Separate zero from unknown. Zero closed deals is a valid result. No CRM connection is not. If a required source is unavailable, mark the affected metric incomplete and send the report for owner review rather than quietly using last week's value.
Prevent duplicate weekly runs
Give each run a unique key based on the reporting period and report version, such as 2026-W39-v1. Before generating or sending anything, check whether that key already completed.
Write the run record with its status, extraction timestamp, source timestamps, output link, reviewer, and send result. A retry may resume a failed run, but it should not create a second digest or message. If corrected data requires another report, issue an explicit revision such as v2 and link it to the first one.
This matters when a scheduler retries after a timeout or someone presses a manual run button because the first email has not arrived yet.
Send exceptions, not a wall of charts
The weekly digest can fit on one screen:
- Reporting period, cutoff, and freshness status
- Five to eight KPI values with comparison to the previous period or target
- Exceptions that need action
- Named owners and due dates
- Drill-down links to the supporting records
Useful exceptions include leads without owners, stage records missing dates, an unexpected conversion jump, stale Sheet inputs, duplicate IDs, overdue actions, failed source connections, and totals that do not reconcile with a control count.
Assign each exception to a person. The sales manager reviews pipeline anomalies; the office manager checks manual Sheet inputs; the bookkeeper reviews invoice figures. The system prepares the evidence. The owner decides whether the data is wrong, the process changed, or the result is real.
Test the report with deliberately bad data
Run at least two historical weeks before relying on the digest. Compare every total with the source records and open every drill-down link.
Then test a duplicate CRM record, a blank owner, an unknown status, a date on the timezone boundary, a stale Sheet tab, a failed extraction, a manual rerun, a late correction, and a metric with a valid zero. Confirm that incomplete data cannot appear as a confident number and that a repeated run cannot send twice.
Keep owner approval in place for the first live reports. Once the definitions, source freshness, exceptions, and links remain reliable, routine delivery can run automatically while unusual cases still wait for review.
If weekly reporting still starts with copying numbers between tabs, request a Flowmatic workflow audit. We will map the sources, metric definitions, validation rules, exceptions, and owner review needed for a dependable first version.
Sources
- [1] https://developers.google.com/workspace/sheets/api/reference/rest/v4/spreadsheets.values/batchGet — Method: spreadsheets.values.batchGet | Google Sheets
- [2] https://developers.google.com/apps-script/guides/triggers/installable — Installable Triggers | Apps Script
- [3] https://support.google.com/docs/answer/186103?hl=en — Create an in-cell dropdown list | Google Docs Editors Help
Make weekly reporting dependable
Map the sources, checks, exceptions, and owner review
Flowmatic can map your CRM and Sheet inputs, metric definitions, freshness rules, exceptions, and review handoffs before recommending a build.
Request a workflow audit